The Meteor-M N2 is a polar orbiting Russian weather satellite that was launched launched on July 8, 2014 15:58:28 UTC with a Soyuz-2.1b/Fregat from Baikonur Cosmodrome, Kazakhstan. Its main missions are weather forecasting, climate change monitoring, sea water monitoring/forecasting and space weather analysis/prediction. The satellite is currently active with a Low Resolution Picture Transmission (LRPT) signal which broadcasts live weather satellite images, similar to the APT images produced by the NOAA satellites. LRPT images are however much better as they are transmitted as a digital signal with an image resolution 12 times greater than the aging analog NOAA APT signals.
Meteor-M polar-orbiting satellites are designed to be used to support Russian hydrometeorological and environment monitoring service and other organizations with operative satellite data, for the solution of following tasks: weather analysis and forecasting on regional and global scale sea water conditions analysis and forecasting (including ice cover monitoring) atmosphere conditions analysis and forecasting for aviation purposes analysis and forecasting of helio-geophysical conditions in near-Earth space environment, ionosphere and geomagnetic field conditions global climate monitoring emergency situations monitoring ecological monitoring of the environment etc.
NASA-Catalog: 40069
Downlink
137.1 MHz and 137.925 MHz at 72/80 kBit/sec LRPT (QPSK)
1.698.5 – 1.7065 GHz at 665.4 kBit/sec rate, including DCP data incapsulated in bit stream
2 autonomous downlink streams in 8048 – 8381.5 MHz band providing data transmission at 122.88 Mbit/s rate each
Status
ACTIVE
Orbital Parameter
NORAD                   40069
COSPAR designator       2014-037-A
Inclination             98.795
RA of A. Node           326.733
Eccentricity            0.0005478
Argument of Perigee     172.396
Revs per day            14.20574738
Period                  1h 41m 22s (101.37 min)
Semi-major axis         7 202 km
Perigee x Apogee        819 x 827 km
BStar (drag term)       0.000037803 1/ER
Mean anomaly            187.731
Payload
- Multi-channel imaging scanner, MSU-MR
- Multi-channel imaging complex, KMSS
- Ultra-high frequency temperature and humidity radiometer, MTVZA-GYa
- Infrared Fourier spectrometer, IKFS-2
- Radar complex, BRLK Severyanin
- Heliophysics instrument complex, GGAK-M
- Radio relay complex, BRK SSPD
MSU-MR (Low-resolution Multispectral Scanner)
The optomechanical MSU-MR instrument provides imagery in six bands in the VIS and IR spectral regions (similar in performance and function to the AVHRR/3 instrument on the POES missions of NOAA) with a spatial resolution of 1 km.
| Band | Nominal spectral band |
|---|---|
| Band 1 (VIS – Visible) | 0.50 ± 0.2 – 0.70 ± 0.2 µm |
| Band 2 (VNIR – Visible Near Infrared) | 0.70 ± 0.2 – 1.10 ± 0.2 µm |
| Band 3 (SWIR – Short Wave Infrared) | 1.60 ±0.50 – 1.80 ± 0.50 µm |
| Band 4 (MWIR – Mid Wave Infrared) | 3.50 ± 0.50 – 4.10 ± 0.50 µm |
| Band 5 (TIR – Thermal Infrared) | 10.5 ± 0.50 – 11.5 ± 0.50 µm |
| Band 6 (TIR – Thermal Infrared) | 11.5 ± 0.50 – 12.5 ± 0.50 µm |
VIS
Das Band 1 ist wichtig für die Wolkenerfassung, Wolkenverfolgung, Szenenidentifizierung und die Überwachung von Landflächen und Aerosolen. Sie können kombiniert verwendet werden, um Informationen zur Vegetation zu erzeugen – ein wichtiges Element für Untersuchungen des Klimawandels. Diese Kanäle sind Solarkanäle und nur während der Tageslichtstunden nutzbar.
NIR, SWIR
Die Bänder 2 und 3 messen das reflektierte Sonnenlicht und helfen bei der Unterscheidung zwischen Schnee und Wasserwolken. Darüber hinaus liefern sie Aerosolinformationen. Diese Kanäle sind für den Flugverkehr wichtig, da man mit ihrer Hilfe Eiswolken erkennen kann.
MWIR
Dieses Band dient in erster Linie zur Erkennung von niedrigen Wolken und Nebel bei Nacht. Es ist ebenfalls für die Messung von Land- und Meerestemperaturen bei Nacht und die Erfassung von Waldbränden nützlich.
TIR
Die Bänder 10.5 und IR 11.5 bezeichnet man als IR-Fensterkanäle, da ihre Sicht der Erdoberfläche und der Oberseite der Wolken nur in geringem Maße von der Gasabsorption in der Atmosphäre beeinflusst wird. Beide Kanäle reagieren auf die Temperatur der Wolken und der Oberfläche. Kombiniert verwendet, messen die zwei Kanäle die atmosphärischen Auswirkungen von niedriger atmosphärischer Feuchtigkeit; daher werden die zwei Kanäle im Allgemeinen als „Teilfenster“-Kanäle bezeichnet. Diese Kanäle werden ebenfalls für die Szenenidentifizierung, die Verfolgung von Wolken, Wolkenhöhen, Oberflächen- und Meeresoberflächentemperaturen, atmosphärische Winde und Schätzungen der atmosphärischen Instabilität genutzt.
Dekodierung des LRPT Signals
Funcube Dongle Pro+ or RTL-SDR and SDR#
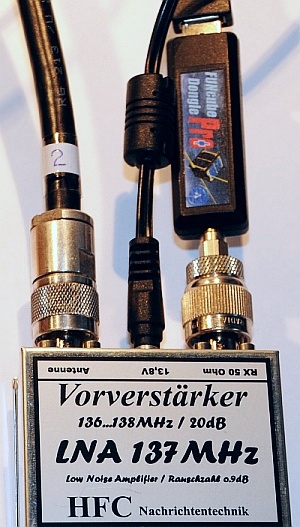
An SDR device capable of handling at least 150KHz wide signals is required to handle the 72KSymb/s or 80 KSymb/s QPSK image.
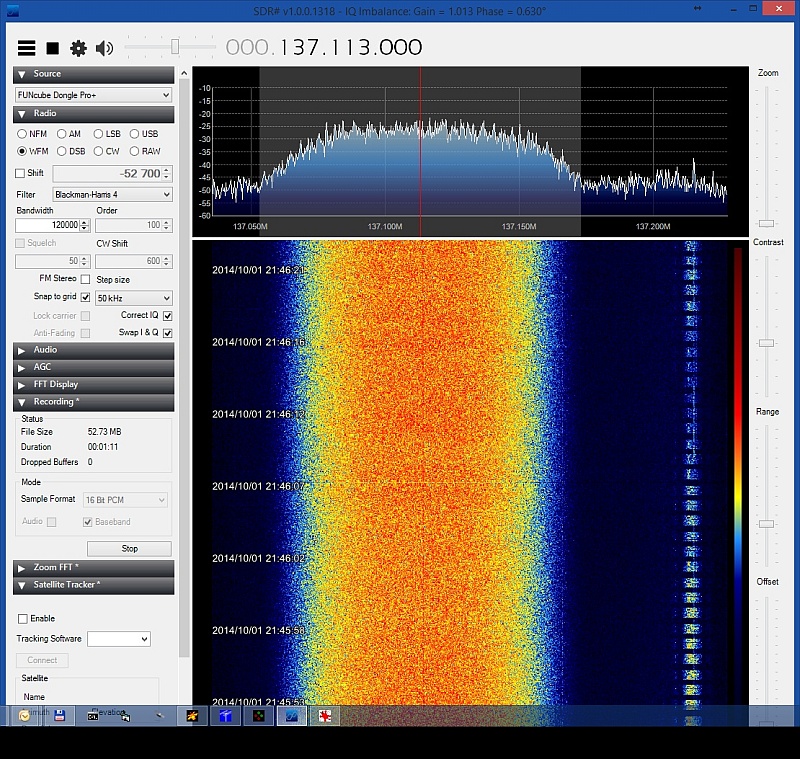
Tree different dongles were tested – an Funcube Dongle pro+, an Ezcap 645 with an FC0013 tuner, a generic RTL2832 with an R820T tuner – all produced excellent imageries, but R820T may required more external amplification due to USB bus noise. In order to view imagery, first we need to record a baseband I/Q WAVE file. It is recommended to use a 0.900 MSPS sample rate at the RTL2832U dongle and maximum (192 KHz) for the Funcube Dongle (FCD), or something near 130 or 150 KHz if you use a different SDR.
The satellite downlink frequency 137.100 or 137.900 has to be chosen as center frequency (137.100 MHz / 72K Symbolrate is currently in use). It doesn’t matter what audio mode, volume or VFO frequency is chosen, because we are recording base-band data centered on the main downlink there is no need neither to do Doppler tracking. Always use „Correct IQ“ and off-set tuning if available.
Now we open LrptRx.exe (the other two programs are not needed*), load the new wav file (insome cases Swap I/Q should be selected, at least when recording with SDRSharp it has been always required). We hit run and manually move the progress slider to the center where signal should be the best. If we obtain a well defined 4 dots constellation, everything is OK, close the program, re-open it and process the entire file.
If at the middle the constellation looks like an X or a square, try changing symbol rate from 72000 to 80000, if constellation is achieved with 4 dots, then the satellite is on 80K mode. It is important to know that when reached the end of the file LrptRx will run forever, unless we manually stop it, so keep an eye on the progress slider.
To extract image from the RAW data we need Oleg’s decoder version 6 or higher and it can be found here. Oleg’s program produces superb color images that can be saved in high resolution! (Under some conditions it may be a good idea to check the „Ignore RS fatal error“ option). Then hit 72K or 80K button depending of the received symbol rate. Browse for the RAW file and open. If you don’t find the file, you can select „All (*.*)“ in the file type filter. Now the program will begin to process the file.Source: http://www.rtl-sdr.com/wp-content/uploads/2014/09/Happysat_Meteosat_LRPT_Tutorial.pdf
Thanks fly out to Raydel Abreu Espinet CM2ESP (Guide), Oleg (LRPToffLineDecoder), Martin Blaho (Linux Scripts), Paul from Australia (LrptRx)!
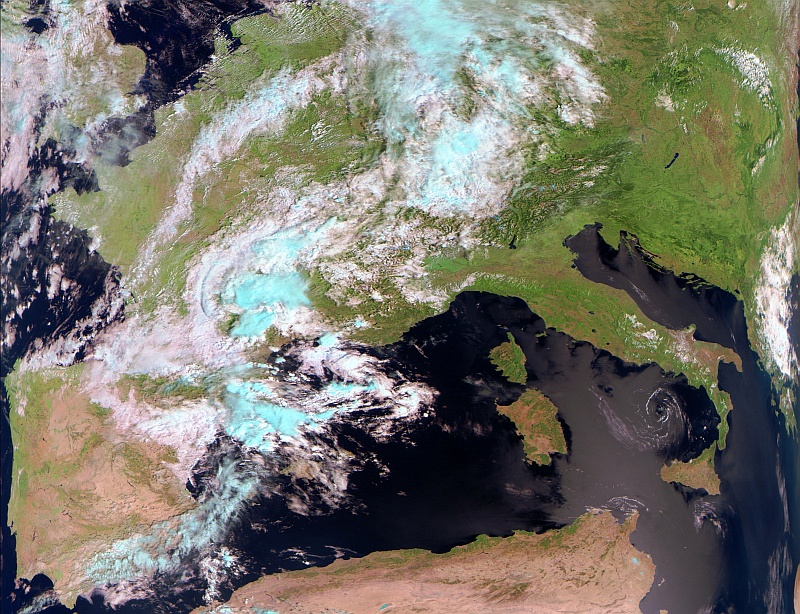
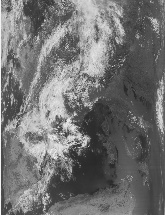
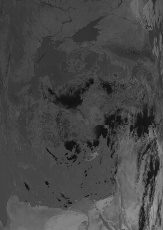
VIS image

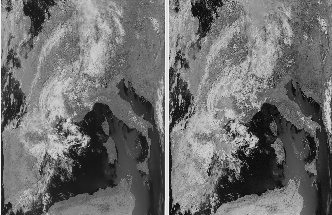
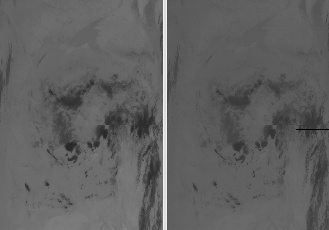
IR image
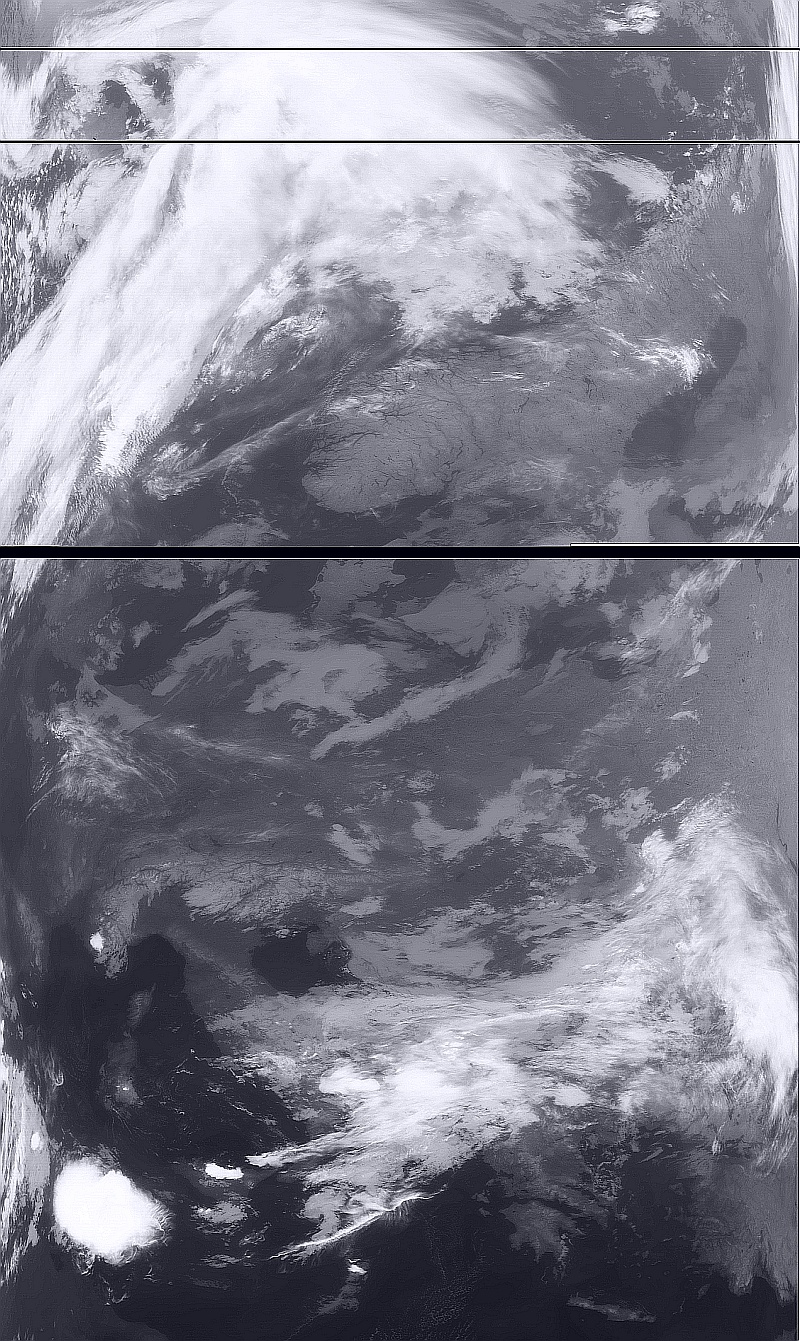
IR image
Links und weitere Informationen
https://directory.eoportal.org/web/eoportal/satellite-missions/m/meteor-m-2